Data Charts
Tools and libraries for creating interactive and dynamic data visualizations.
Data charts provide a way to visualize data in a clear and interactive manner, making it easier to understand and analyze.
They are widely used in applications that require data visualization and analysis.
Experience:
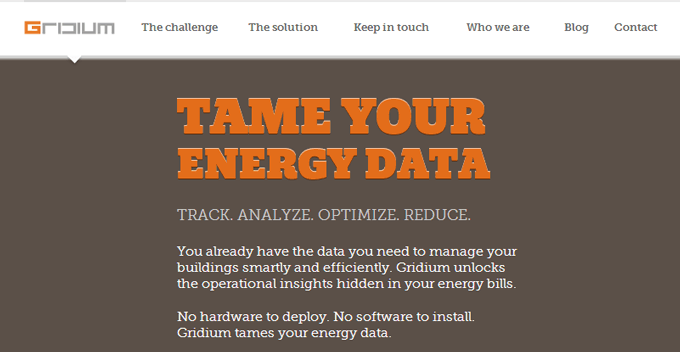
Implemented data charts in projects like Gridium for interactive and dynamic data visualization.