Gridium
An energy-analytics application with interactive charts for monitoring commercial-building consumption data.
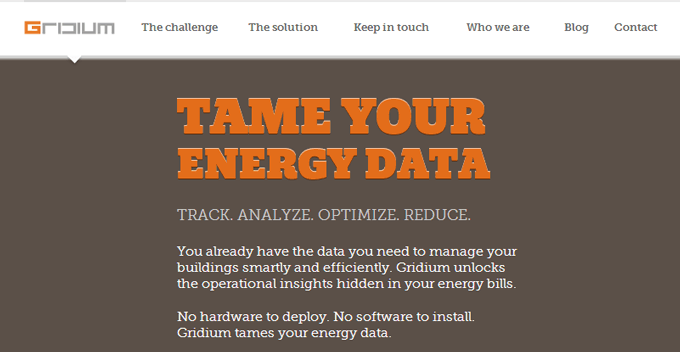
Gridium is Menlo Park energy-management software for commercial buildings that analyzes smart-meter data without extra hardware installs. I built an early version of the analytics UI when the company was turning 15-minute meter reads into charts property teams could act on.
The interactive views tracked demand and cost signals so users could spot variances from normal behavior across a portfolio, and I tuned chart layouts so those readings stayed legible on desktop dashboards.
Achievements
- Built the first version of a data visualization app for energy consumption analytics.
- Implemented interactive charts for realtime energy monitoring.
- Tuned chart layouts for readability.
Link: https://gridium.com/
Stack: JavaScript, Data Charts, CSS, Bootstrap, Heroku
Experience: Frontend